
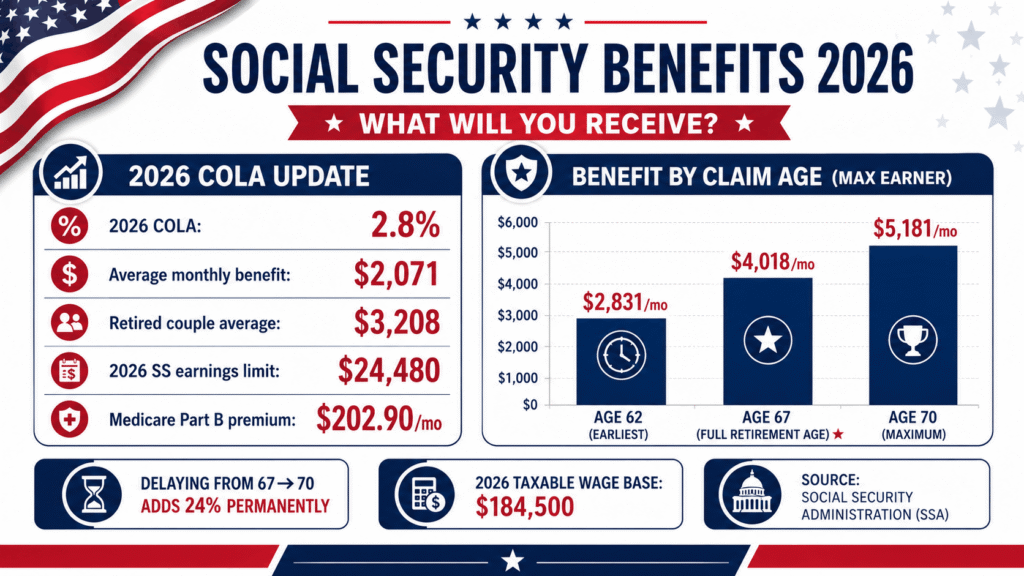
The average Social Security retirement benefit in 2026 is $2,071 per month — following the 2.8% Cost-of-Living Adjustment (COLA) applied from January 2026, the largest COLA since the 2023 inflation surge. The maximum possible benefit for someone claiming at Full Retirement Age is $4,018/month, rising to $5,181/month if you delay until age 70. Your exact benefit depends on your 35 highest-earning years and when you choose to claim.
Use our free Social Security Calculator 2026 to estimate your monthly benefit at age 62, 67 or 70 — no signup or SSA account required.
2026 Social Security Key Numbers — Official SSA Data
| Metric | 2025 Amount | 2026 Amount | Change |
|---|---|---|---|
| COLA Increase | 2.5% | 2.8% | +0.3% |
| Average Retired Worker Benefit | $2,015/mo | $2,071/mo | +$56/mo |
| Average Retired Couple | $3,120/mo | $3,208/mo | +$88/mo |
| Max Benefit at FRA (67) | $3,910/mo | $4,018/mo | +$108/mo |
| Max Benefit at Age 70 | $5,108/mo | $5,181/mo | +$73/mo |
| Taxable Wage Base | $176,100 | $184,500 | +$8,400 |
| Earnings Limit (under FRA) | $22,320/yr | $24,480/yr | +$2,160/yr |
| Medicare Part B Premium | $185.00/mo | $202.90/mo | +$17.90/mo |
Source: Social Security Administration (SSA.gov), October 2025 COLA announcement; Congress.gov CRS Report May 2026. The 2026 COLA of 2.8% was slightly offset for many retirees by the $17.90 increase in Medicare Part B premiums deducted from SS payments.
Social Security Benefit by Claim Age 2026 — Maximum Amounts
Your monthly Social Security benefit is permanently affected by the age at which you claim. Here are the maximum possible benefits at each claiming age in 2026 (for someone with maximum taxable earnings for 35 years):
| Claim Age | Maximum Monthly Benefit | vs Full Retirement Age | Notes |
|---|---|---|---|
| 62 (Earliest) | $2,831/mo | −29.5% | Permanent reduction |
| 64 | $3,175/mo | −21% | Still reduced |
| 66 | $3,795/mo | −5.6% | Near FRA |
| 67 ⭐ Full Retirement Age | $4,018/mo | Baseline (100%) | Born 1960+ |
| 68 | $4,339/mo | +8% | Delayed credits |
| 69 | $4,660/mo | +16% | Delayed credits |
| 70 (Maximum) | $5,181/mo | +24% | No further increase |
Estimated Monthly Benefit by Income Level (Claiming at FRA 67)
Most Americans don’t earn maximum taxable wages for 35 years. Here are realistic estimated benefits based on average career earnings:
| Average Annual Earnings | Estimated Benefit at 67 (FRA) | Estimated at 62 | Estimated at 70 |
|---|---|---|---|
| $30,000/year | ~$1,200/mo | ~$840/mo | ~$1,490/mo |
| $50,000/year | ~$1,680/mo | ~$1,176/mo | ~$2,083/mo |
| $75,000/year | ~$2,100/mo | ~$1,470/mo | ~$2,604/mo |
| $100,000/year | ~$2,520/mo | ~$1,764/mo | ~$3,125/mo |
| $150,000+/year | ~$3,200/mo | ~$2,240/mo | ~$3,968/mo |
| Maximum earner (35 yrs) | $4,018/mo | $2,831/mo | $5,181/mo |
These are estimates based on consistent earnings over 35 years. Actual benefits depend on your complete indexed earnings history. Always check your personal estimate at ssa.gov/myaccount.
Age 62 vs 67 vs 70 — Which Is Better?
The most important Social Security decision is when to claim. There is no universally right answer — it depends on your health, other income, marital status and life expectancy. Here is the break-even analysis:
| Comparison | Break-Even Age | Best Choice If… |
|---|---|---|
| Age 62 vs Age 67 | ~Age 79 | Live past 79 → claim at 67. Shorter lifespan or immediate need → claim at 62. |
| Age 67 vs Age 70 | ~Age 82 | Live past 82 → delay to 70. Health concerns or other income → claim at 67. |
| Age 62 vs Age 70 | ~Age 83 | Live past 83 → delay to 70. Every year after 83 is worth ~$28,200 more ($2,350 × 12). |
Married couples strategy: The lower-earning spouse typically claims early (providing income now) while the higher earner delays to 70 (maximising the survivor benefit). When one spouse dies, the survivor inherits the higher of the two benefits — so maximising the higher earner’s benefit is critical.
How Social Security Calculates Your Benefit
The SSA uses a specific formula to calculate your Primary Insurance Amount (PIA) — the benefit you receive at Full Retirement Age:
- Collect your 35 highest-earning years — years with zero earnings count as $0 and drag your average down
- Index earnings for wage inflation (Average Indexed Monthly Earnings — AIME)
- Apply bend points: 90% on first $1,174 of AIME + 32% on $1,174–$7,078 + 15% on amount above $7,078 (2026 bend points)
- Adjust for claiming age: Early reduces PIA; late increases it
The bend point formula is intentionally designed to replace a higher percentage of income for lower earners — meaning Social Security is more valuable relative to earnings for those with lower career incomes.
Social Security and Medicare in 2026 — Net Benefit After Premium
Most Social Security recipients have Medicare Part B premiums automatically deducted from their monthly benefit. The 2026 COLA of 2.8% raised the average retired worker benefit by $56/month, but Medicare Part B premium increased by $17.90 to $202.90/month in 2026, reducing the net gain to approximately $38/month for many retirees.
Net monthly benefit after Part B premium deduction: $2,071 − $202.90 = ~$1,868/month for the average retiree.
Is Social Security Taxable in 2026?
Yes — depending on your combined income, up to 85% of your Social Security benefit may be subject to federal income tax:
| Combined Income* | Single Filer | Married Filing Jointly | SS Benefit Taxable |
|---|---|---|---|
| Below lower threshold | Under $25,000 | Under $32,000 | 0% |
| Middle range | $25,000–$34,000 | $32,000–$44,000 | Up to 50% |
| Above upper threshold | Over $34,000 | Over $44,000 | Up to 85% |
*Combined income = Adjusted Gross Income + non-taxable interest + half of Social Security benefit
Social Security Calculator 2026
Estimate your monthly Social Security benefit at age 62, 67 or 70 based on your current income and years worked:
👉 Free Social Security Calculator 2026 — No Signup Required →
Frequently Asked Questions
How much is the average Social Security benefit in 2026?
The average Social Security retirement benefit in 2026 is $2,071 per month — up from $2,015 in 2025 following the 2.8% COLA increase effective January 2026. The average retired couple receives $3,208/month combined. Source: SSA 2026 COLA Fact Sheet.
What is the Social Security COLA for 2026?
The 2026 Social Security COLA is 2.8% — up from 2.5% in 2025. This added approximately $56/month to the average retiree’s benefit from January 2026. However, the Medicare Part B premium also increased by $17.90/month to $202.90, partially offsetting the COLA gain for many retirees. Source: SSA.gov.
What is the maximum Social Security benefit in 2026?
The maximum Social Security retirement benefit in 2026 is $2,831/month at age 62, $4,018/month at Full Retirement Age (67), and $5,181/month if delayed to age 70. To receive the maximum, you must have earned at or above the taxable wage base ($184,500 in 2026) for 35 years. Source: SSA.gov.
What is the Full Retirement Age for Social Security in 2026?
For anyone born in 1960 or later, Full Retirement Age (FRA) for Social Security is 67. Claiming before 67 permanently reduces your benefit; claiming after 67 increases it by 8% per year up to age 70 (a maximum 24% increase for those born 1960+).
What is the Social Security earnings limit in 2026?
If you claim Social Security before FRA and continue working, the 2026 earnings limit is $24,480/year. The SSA withholds $1 for every $2 earned above this limit. In the year you reach FRA, the limit rises to $65,160 with $1 withheld per $3 above that. Once you reach FRA, you can earn unlimited income with no SS reduction. Source: SSA.gov COLA 2026 Fact Sheet.
Is Social Security taxable in 2026?
Yes — potentially. If your combined income (AGI + non-taxable interest + half your SS benefit) exceeds $34,000 (single) or $44,000 (married filing jointly), up to 85% of your Social Security benefit may be included in your taxable income. Below $25,000 (single) or $32,000 (married), no SS benefit is taxable.
Related Calculators
- 🇺🇸 Social Security Calculator 2026 — Estimate benefit at 62, 67 or 70
- 🇺🇸 US Income Tax Calculator — Federal tax on all income sources
- 🇺🇸 401(k) Calculator — Retirement savings growth with employer match
- 🇺🇸 FIRE Calculator — Financial independence retirement planning
- 🇺🇸 Lump Sum Investment Calculator — One-time investment growth
Last updated: July 2026. Based on SSA 2026 COLA Fact Sheet (October 2025), Congress.gov CRS Report on Social Security COLAs (May 2026), and AARP 2026 benefit analysis. Sources: Social Security Administration (ssa.gov), AARP (aarp.org). This article is for informational purposes only — always verify your personal benefit estimate at ssa.gov/myaccount.